Context
The Dataset has information about 100k orders from 2016 to 2018 made at multiple marketplaces in Brazil. Its features allow viewing an order from multiple dimensions: from order status, price, payment and freight performance to customer location, product attributes and finally reviews written by customers.
This Dataset was generously provided by Olist, the largest department store in Brazilian marketplaces. Olist connects small businesses from all over Brazil to channels without the hassle and with a single contract. Those merchants are able to sell their products through the Olist Store and ship them directly to the customers using Olist logistics partners.
After a customer purchases the product from Olist Store a seller gets notified to fulfill that order. Once the customer receives the product, or the estimated delivery date is due, the customer gets a satisfaction survey by email where he can give a note for the purchase experience and write down some comments.
The module data_analysis.py contains the functions that bring the order and structure to the selected data.
The first part provides a general overview of the data, prints samples, and Null values. The second part prepares the data for the following analysis, extracting the relevant information.
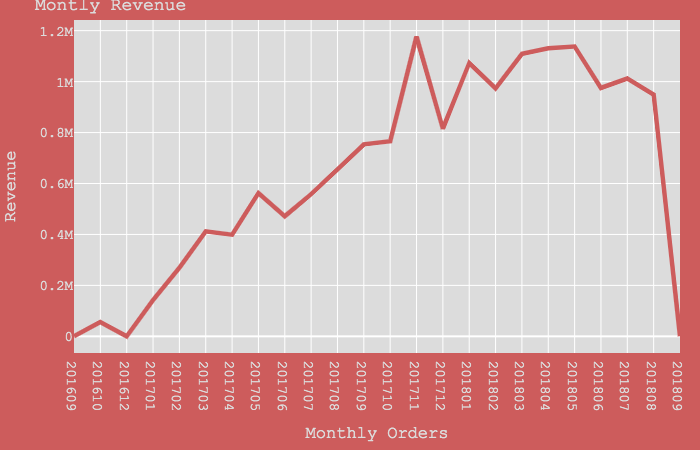
Further on, Monthly Revenue and Revenue Growth Rate are calculated and visualized on a graph.
Monthly Revenue grew steadily until November 2017 when it reached its peak of 1.176 million BRL. December followed by a drop to the amount of the previous month of October. A slight increase in orders by two hundred thousand is observed in January with a backdrop and raise of about a hundred thousand in March 2018 and remained relatively the same all the way through April till May 2015. Starting from the month of May, the orders decreased to 1 million and from August to September plummeted to zero in one month.
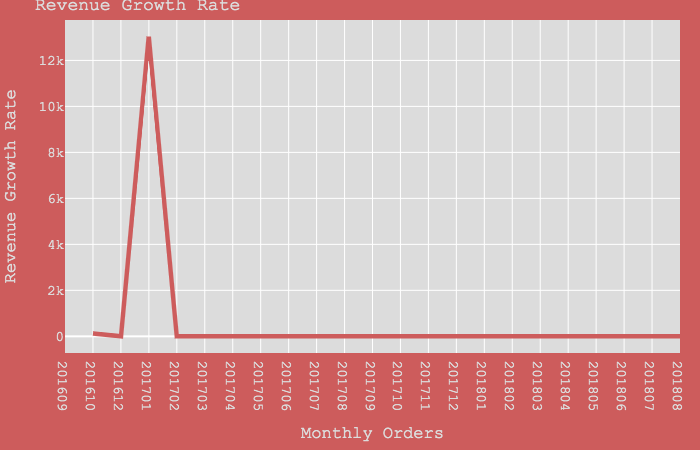
The maximum Revenue Growth Rate was reached in January 2017 and is 13033%. A more thorough look into details is required to investigate the сausal relationship that generated such a result.
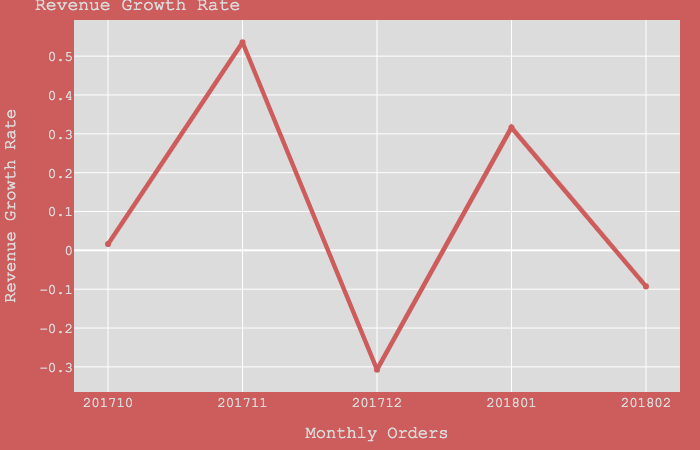
Zoom in to random 4 month period from 201709 to 201803 reveals minor fluctuations within +0,5% and -0,3%.
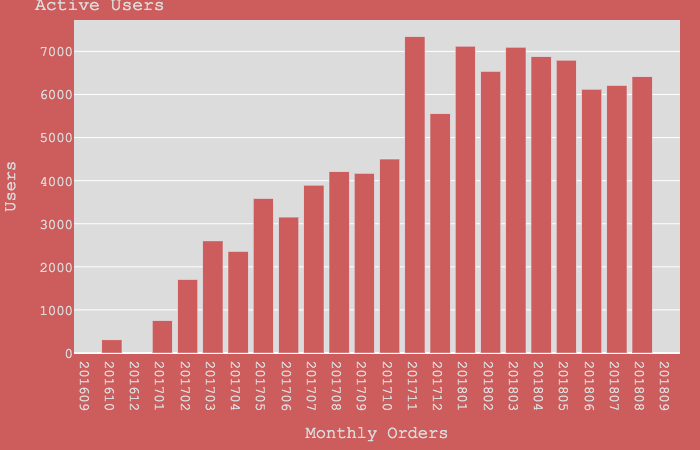
One way to increase revenue is to understand the client's behavior. Therefore, first, we need to keep the track of Monthly Active Users. A record quantity of 7342 active users ordered in November 2017. From May 2017 when the number of users reached 3588 users the monthly number doubled in November 2011 and until September 2018 was not going lower than 5557 users(201712). September 2018 had no active users which explain the abrupt revenue drop.
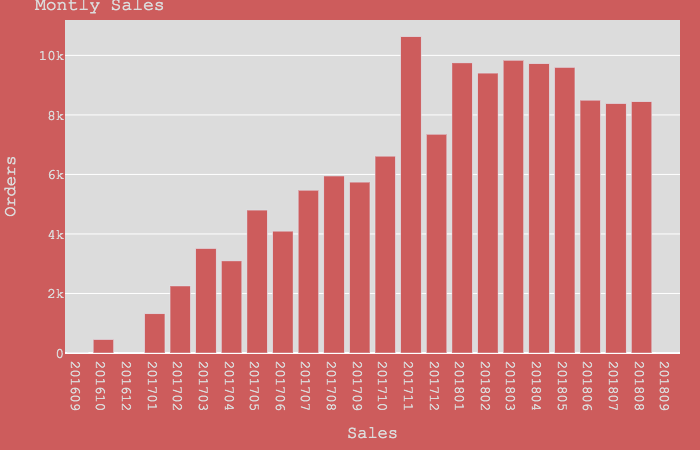
Next, we are going to look at the Monthly Sales. As expected, the record amount of 10.63k items were sold in November 2017.. The plot pattern looks similar in shape to the monthly active users.
 /
/
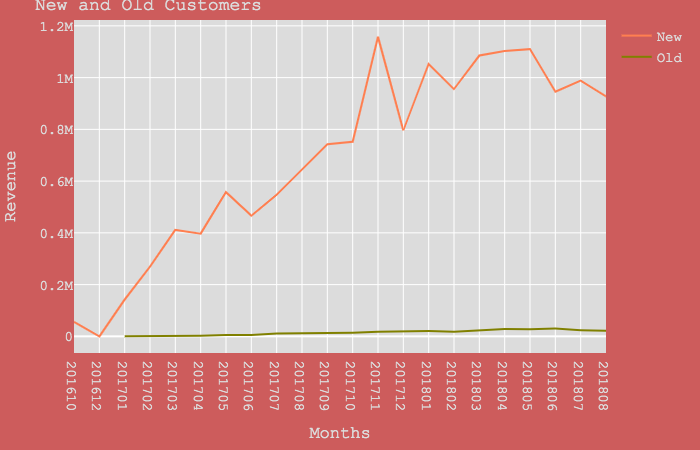
To explore business growth opportunities, the management needs to know its loyal customer rate. In order to do this, first, we should try to plot on the graph new and old customers. The pattern of the plot resembles monthly revenue graph. It also reveals that new clients brought almost all of the business revenue. June 2018 brought 29.87k BRL in revenue by old customers comparing to 945.20k BRL by the new ones.
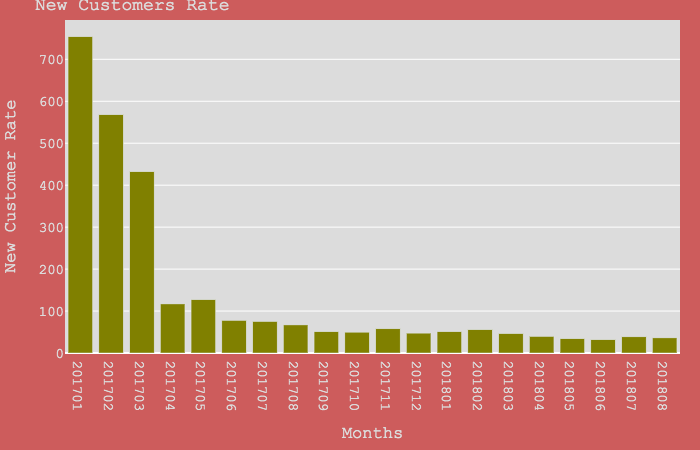
Now we will plot the ratio of the old clients to the new ones. The biggest difference of 754 can be noticed at the same time when the first repeat purchases were made in January 2017. The lowest rate 31 was in August 2018.
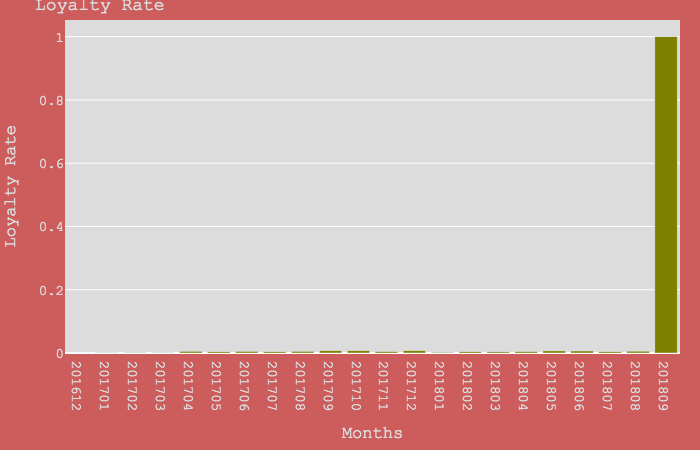
Finally, we can build the graph for the Loyalty Rate (the quotient obtained by dividing loyal customers by total customers). Ironically, our graph displays the most loyal month of two years as September 2018, when the revenue dropped to zero and there were no orders made, giving it an index of one. This is explained by the fact that the more loyal customers there are the closer the quotient to one and the less loyal customers there are the closer the quotient to zero, because the amount of the loyal customers can never be larger than the amount of the total customers. Therefore the output of Cohort Loyalty Rate that this data analysis module contains on the data has no practical significance.
Summarising this brief data analysis, it is necessary to mention, that despite the low loyalty rates that have been observed, there is still a window for a business opportunity. Further marketing research may shed light on new ways to increase sales.